Don’t ignore the savings that are within. The search for buried treasure may not be as difficult as you think. We hear a lot about the need for increased sales and of course this is important for the long term success of any business.
But often, business who have grown in size due to increased sales have not improved their processes at the same pace.
This means that there is a lot of hidden opportunity which is waiting to be found. This exists because the drive to increase output has resulted in bad habits and short-cuts developing, optimisation being secondary and many examples of the eight wastes of manufacturing being present.
Yet the focus will continue to drive sales, and so it should.b But stop, just for a moment, and consider the opportunity that exists from within. A business with a 10% margin will make £1M off £10M revenue. But to generate £400K in additional profit, they would need to find £4M in extra sales. Yet the same business could achieve the same value of increased profit by making a 20% improvement in operating costs. And making such savings will not only benefit the business, it will generate the feeling of success within the workforce too.
The benefits of Lean Manufacturing and Operational Excellence have long been understood but there has never been a better time to integrate these proven methods with the digital technology that has evolved to underpin the steps.
Visual Management has never been presented with such clarity and has never been more prominent. Data has never been so accessible and engaging. Progress and performance has never been so well communicated and this is all thanks to digital technology.
One of the best examples is how OEE is no longer a concept which is understood by the Engineering specialists, with the evolution of technology on the shop-floor, it is a catalyst for change and for engagement with all production employees.
In today’s super-fast-paced manufacturing industry, businesses striving for smarter, data-led operations are turning their attention to a simple yet powerful question! How effectively are our machines really working? This is where a focus on metrics like Overall Equipment Effectiveness (OEE) and tools like OEE dashboards come into play.
Define OEE – what does it mean?
To define OEE, think of it as a single percentage that summarises how well a machine, line or process is performing compared to its full potential. It captures three key dimensions:
- Availability: Is the equipment actually running when it should?
- Performance: When it’s running, is it operating at the expected speed or throughput?
- Quality: Of the parts produced, how many meet the required standard?
By multiplying these three factors, you get the OEE score. In other words: OEE = Availability × Performance × Quality.
When measured and understood properly, OEE becomes a practical measure of your manufacturing productivity, telling you the portion of scheduled production time that was truly productive.
Understanding OEE – why it matters.
For modern factories, understanding OEE is more than just knowing a number. It’s about:
- Seeing where time is being lost (for example, due to
- downtime or changeovers).
Spotting when machines aren’t hitting their full speed or output potential. - Figuring out when quality issues (scrap, rework) are reducing effective production.
These key insights help shift manufacturing from being reactive (fixing breakdowns) to becoming proactive (avoiding them!), which is critical in a world where flexibility, speed and cost control matter more than ever.
What are OEE Dashboards?
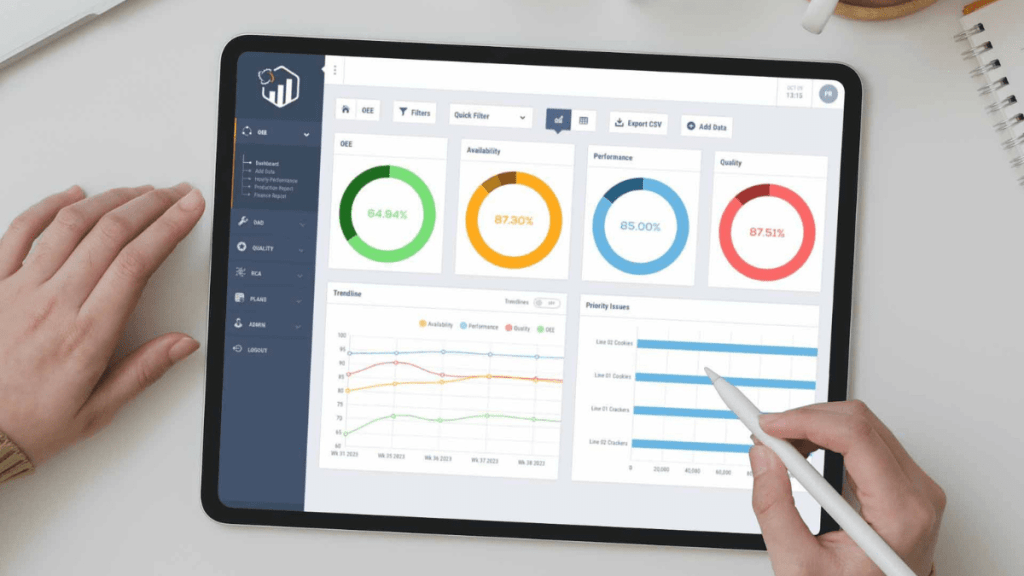
OEE dashboards are a visual display – often digital and live – that brings together OEE metrics, trends and related data in one place. It acts as the ‘digital bridge’ between raw operational data (sensor signals, machine logs and shift data) and actionable insight for both engineers and management.
Key features tend to include:
- Real-time or near real-time availability, performance and quality metrics.
- Trend lines showing how OEE and its components change over shifts, days or even weeks.
- Alerts or flags when one of the components drops below acceptable levels.
- Ability to drill down into root causes (such as repeated downtime on a specific piece of equipment).
In short, the dashboard turns the question “how are we doing?” into “what should we do about it?!”.
Why OEE Dashboards Matter for Modern Manufacturing…
Here are a few reasons why an OEE monitoring system is so important in a modern manufacturing context:
Visibility – Without visibility, you’re operating blind. A dashboard gives both the engineers and the management team clear and shared visibility of manufacturing productivity.
Alignment – With a shared dashboard, everyone sees the same KPIs, helping to align teams around common goals, rather than fragmented, siloed measures.
- Speed of reaction – When a drop in performance or availability is flagged in real time, it allows quicker investigation and corrective action!
- Continuous improvement – Over time, you are building a history of OEE data, enabling you to benchmark, set targets and drive improvement initiatives.
- Data-led decision making – Rather than relying on your gut feeling, you have data on what’s working and what isn’t… enabling smarter investment, staffing and maintenance decisions.
For manufacturers looking to raise productivity, reduce waste and become more agile, an OEE monitoring system is certainly a key building block of that transformation.
Simple Examples of Insights OEE Dashboards Can Reveal.
To bring this to life, here are a few straightforward examples of what OEE dashboards might highlight, and what that might prompt the team to do:
- Example 1 – Availability drop. The dashboard shows that machine A’s availability has fell from 90 % to 70 % over the last week. On drilling down, you see multiple minor stoppages (idling) and one unplanned breakdown on a specific shift. Action – schedule a maintenance review and revisit the changeover process on that shift.
- Example 2 – Performance lag. A line has high availability and good quality, but the performance metric shows only 75 % of the ideal speed. Insight – throughput is slower than the target. Possible causes – worn tooling, sub-optimal setup, operator training. Action – investigate cycle-time losses, inspect tooling and schedule training or adjustment.
- Example 3 – Quality issue. The OEE dashboard shows quality has dropped to 82 % this morning. The rest of the metrics are stable. On inspection, you find increased rework due to a particular component type. Action – stop the line, check supplier component quality or machine settings, and adjust process parameters.These kinds of insights might previously have taken days or weeks to appear via manual reports… the dashboard makes them immediate, visible and actionable.
Conclusion
In sum, if your factory is aiming to become a smarter, data and insights-driven operation, then understanding OEE, learning to define OEE, and harnessing OEE dashboards via an effective OEE monitoring system are foundational elements. They translate the broad goal of boosting manufacturing productivity into specific, measurable, visible actions.
Equipping both engineers and management with the same clear view means faster responses, better alignment and steady continuous improvement. When production is complicated and competitive pressures high, clarity and insight become an advantage — and the right OEE dashboards give you that clarity.
Ready to see your data differently?
At POET Systems, we help manufacturers turn complex production data into clear, actionable insight. Our real-time OEE dashboards make it easy to monitor performance, spot inefficiencies, and improve productivity – all from one intuitive platform.